Summary
- Citigroup's performance metrics, such as ROTCE and tangible book value growth, vastly lag behind its peers. Therefore, its price to tangible book value remains low at 0.7x.
- Contrary to others, Citi has been the only major bank that has seen a decline in non-interest income over the last two Q1 results.
- However, their aggressive restructuring plan, which intends to divest from 14 markets and reduce headcount considerably, could potentially allow them to simplify their business and raise the price-to-TBV multiple.
- The restructuring plan might take several years to produce an effective response, but I am optimistic about this opportunity to turn around the profitability indicators of this bank.
Nils Versemann/iStock Editorial via Getty Images
Citigroup (NYSE:C)(NEOE:CITI:CA) is in an interesting spot. Over many years, it has underperformed considerably against peers such as JPMorgan (JPM), Bank of America (BAC), and recently Wells Fargo (WFC) in terms of stock appreciation and relevant metrics for a bank. However, the aggressive restructuring plan that CEO Jane Fraser and CFO Mark Mason are implementing might help lay the first bricks to turn around the situation and stick closer to its peers in terms of financial performance. In this analysis, I will briefly discuss the revenue drivers of Citi, their restructuring plan, financial evolution, stock price action, and valuation to finally come up with a buy rating, taking into account the risks of the restructuring plan not making any meaningful effect or even affecting negatively the longer-term financial performance.
Business Overview & Revenue Drivers
Citigroup is a diversified bank with an on-ground presence in 94 countries. Among the major U.S. banks, it ranks #4 in terms of deposits and net loans. As of Q1, Citigroup registered $1,307,163 million in total deposits and $656,282 million in net loans on its balance sheet. Also, it is the bank with the lowest metric in non-interest bearing deposits to total deposits at 15.3%. JPMorgan, for example, has a superior ratio of 28.1%
| Q1 2024 (in $M) | Revenue | % of Revenue | Operating Income | % of OI |
| Markets | 5,378 | 25.5% | 1,410 | 41.4% |
| US Personal Banking | 5,178 | 24.5% | 347 | 10.2% |
| Services | 4,766 | 22.6% | 1,519 | 44.6% |
| All Other—managed basis | 2,385 | 11.3% | -463 | -13.6% |
| Banking | 1,714 | 8.1% | 539 | 15.8% |
| Wealth | 1,695 | 8.0% | 150 | 4.4% |
Citi 10-Q
Citigroup recently eliminated some reporting geographical locations and simplified it to North America and International only. Moreover, several reporting segments were eliminated, and now only five segments are present. These are Markets, Services, Banking, US Personal Banking, and Wealth. Out of those, in Q1, Markets brought 25.5% of the revenue at $5.378 billion, and its operating profit contribution was even superior, representing 41.4% of those. At the same time, even though Services only constituted 22.6% of the Q1 revenue, the segment helped explain the majority of the operating income at 44.6%. Contrarily, a segment such as US Personal Bank brought $5.178 billion in revenue, but that only accounted for 10.2% of the operating profit vs. 24.5% in revenue.
Of that total revenue of Citi, roughly 60% came from net interest income after loss provisions, and the remaining 40% came from non-interest income.
Citi's Restructuring Plan
For several years now, the price of the tangible book of Citi has sat at shallow levels, which are even comparable to the ones exhibited during the great financial crisis, but clearly, these are companies at different stages. Citi's low multiple is justified by its low return on tangible equity. And the way to increase ROTCE (to later increase price-to-tangible equity) is by removing the “tangible book” and maintaining the most profitable businesses. That exactly is the corporate strategy that Citigroup is implementing by hosting a massive restructuring plan that targets divesting from 14 consumer markets and adjusting their management structure.
In September, Citi realigned its organizational structure to operate only within five business segments and progressed in removing unnecessary hierarchical complexity. In April, the company finalized its “Project Bora Bora,” which resulted in 7,000 job cuts where the bank expects to save $1.5 billion in expenses going forward. This implies that each terminated employee was earning an average of $214,000 per year. And still with these savings, Citi expects to conduct a total of 20,000 job cuts globally over the next two years.
Some of the markets Citi plans to exit either fully or partially are the Mexican, Korean, Russian, and Chinese markets. Regarding the latter, Citi just sold its Consumer Wealth portfolio to HSBC and will later transfer its Chinese credit card portfolio to the Fubon Bank. Nonetheless, it plans to open a China-based investment bank by the end of the year.
From the Mexican side, Citi announced its plan to exit a significant part of its Mexican market in 2022, following the sale of its Asset Management Business to BlackRock (BLK) in 2018. They first planned a sale, which they failed to finalize. Now, they aim to spin off part of the business and make Banamex (Citi's bank in Mexico) public via an IPO while maintaining the institutional business and banking license in Mexico. Citi plans to conduct the spin-off in H2 2024 and the IPO in 2025. Currently, the Mexican public market has exhibited some valuation changes, as after the Mexican elections, the MSCI Mexico ETF came down by 12.5%. Despite this, CFO Mark Mason reiterated on Monday on Bloomberg TV their intention to divest part of Banamex despite the recent elections.
As of Q1 of 2024, Grupo Financiero Citibanamex reported $252,844 million pesos in equity, which translates to $14,037 billion (6.77% of Citi's total equity) based on a quarter-ended exchange rate of 18.0099.
Financial Evolution of Citigroup
| $M | Mar-22 | Mar-23 | Mar-24 | CAGR |
| NIM | 2.05% | 2.41% | 2.42% | 8.7% |
| Net Interest Income | 10,871 | 13,348 | 13,507 | 11.5% |
| Provision For Loan Losses | 260 | 1,737 | 2,422 | 205.2% |
| Non-Interest Income | 8,317 | 8,116 | 7,587 | -4.5% |
Seeking Alpha | Citi 10-Qs
Citi's financial performance has been mixed since the quarter when rate hikes started (Q1 22).
- Net interest margin (NIM) has expanded at a CAGR of 8.7% and now sits at 2.42%, but it has contracted seven bps from Q3 23 as funding costs rose.
- Net interest income has grown 11.5% over the last two years, reaching its peak in Q2 22. Higher NIM helped, as the balance sheet showed a similar amount of net loans in Q1 22 and Q1 24.
- Provisions for loan losses have vastly expanded, from $260 million in Q1 22 to $2.422 billion in Q1 24, but they are slightly improving from Q4 23. From the side of US personal banking, this provision increase is primarily due to the continued maturation of credit card loans originated during the pandemic and delayed losses from government stimulus.
- Non-interest income has decreased yearly, at a CAGR of 4.5%. This is different from other competitors, who saw strength in non-interest income due to rising markets in 2023 and a recovery from deal activity.
C Price Action
Data by YCharts
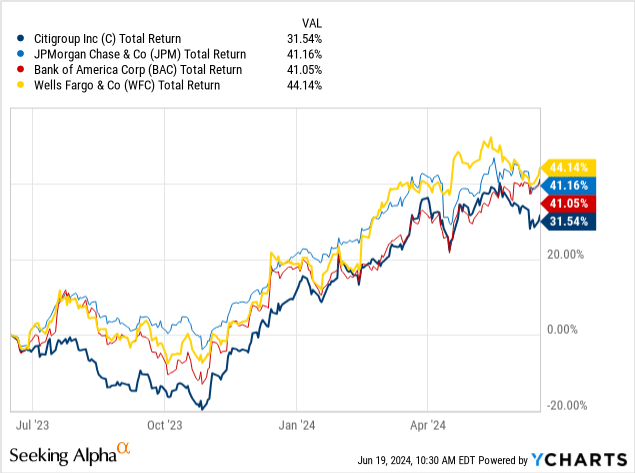
Big US bank stocks have benefited from rate cut expectations and a strong US consumer base. Over one year, Citi obtained a total return of 31.5%, with particular strength in November, December, and March. Yet, this handsome performance wasn't enough to outperform peers such as Wells Fargo, JPMorgan, and Bank of America, all of whom surpassed the 40% mark.
| Total Return | 3M | 6M | 1Y | 3Y | 5Y |
| C | 4.56% | 24.62% | 31.54% | 1.05% | 7.85% |
| JPM | 2.85% | 19.94% | 41.16% | 44.91% | 106.40% |
| BAC | 11.72% | 21.18% | 41.05% | 11.32% | 58.17% |
| WFC | 2.80% | 20.45% | 44.14% | 52.53% | 47.37% |
YCharts
When zooming out from the one-year return, Citi has shown a tendency to underperform its competitors. From a 3-year lookback period, Citi only obtained a poor 1.05% return. And yes, this is a total return figure that includes the dividends paid. The same occurred with the 5-year period. From one side, JPM obtained a return of 106.4%, while Citi remained with a modest 7.85%.
Now, when zooming in, Citi has been the peer group outperformer over the last six months, achieving a 24.62% return that surpasses all of its peers. On a three-month basis, Citi stands second after Bank of America, which has benefited the most with a stellar 11.72% return even after falling -3.53% the day of the earnings announcement.
Citigroup Valuation
Data by YCharts
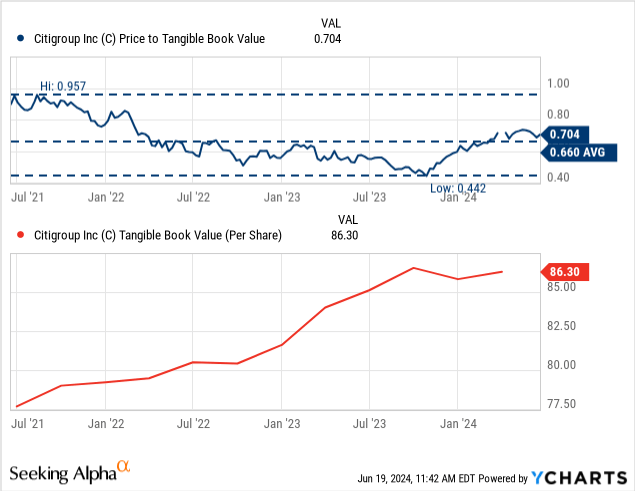
Over the past three years, Citi (after rounding) has only achieved once to trade at a level of exactly its tangible book value per share. After that, the valuation kept dropping to the point where it got to a P/TBV of up to 0.42x and now recovered to 0.70x after a stock rebound since November. From the three-year average, the current multiple stands near the historical average. At the same time, their tangible book value has gained value almost every quarter and sits 11.11% above the three-year start. Despite this, the deterioration of the numerator of the multiple (price) has taken a more significant effect than the tangible book growth, and therefore, the P/TBV has dropped over this timeframe.
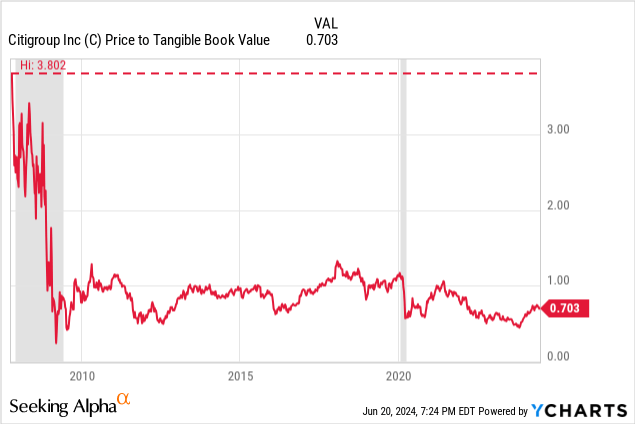
To put it into perspective, these low multiple levels have guided Citi since the months emerging from the great financial crisis, with very few times crossing the line of the 1x tangible book value, as seen in the graph below.
Data by YCharts
Author's Compilations | Data: C 10-Qs
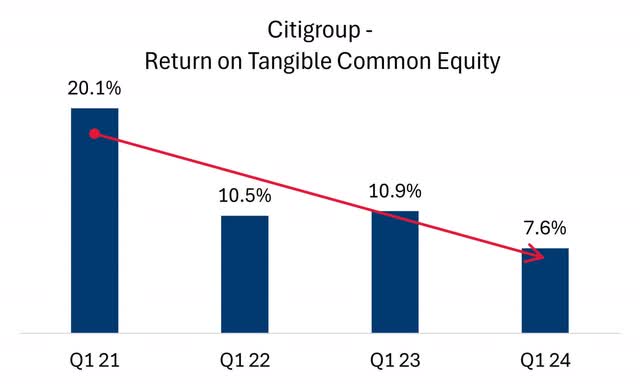
As commented above, returns on that TCE will help justify the price at which that tangible common equity trades. For Citigroup, the trend hasn't been ideal over the past three years. In Q1 21, the company achieved an ROTCE of 20.1%, which halted in Q1 22 and now sits pretty low at 7.6% compared to its history and the other major US banks.
| C | JPM | BAC | WFC | |
| Price to Tangible Book Value | 0.704x | 2.334x | 1.595x | 1.597x |
| TBVPS 3Y Growth | 11.11% | 26.80% | 14.59% | 11.24% |
| ROTCE | 7.60% | 21.00% | 12.73% | 12.30% |
YCharts | Companies' 10-Qs
When looking at key metrics, the valuation rank of the peers in terms of price-to-TBV, is directly related to their growth in tangible equity growth and ROTCE. In this case, JPM has achieved a handsome TBVPS 3-year growth of 26.80% while having the soundest ROTCE at 21%, resulting in a multiple of 2.33x the tangible book value. Contrarily, Citigroup is the bank that has accumulated the most minor growth and lacks its peers in terms of return to tangible common equity at 7.6%.
Data by YCharts
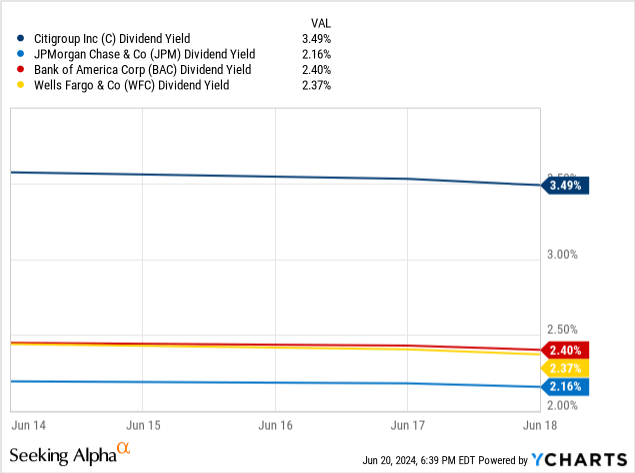
Finally, from the dividend side, Citi is the bank that offers the highest dividend yield at 3.49%. Nonetheless, this ratio is inflated by Citigroup's superior payout ratio of 38.31% compared to other banks. For example, JPM has a payout ratio of 26.66%, BAC of 32.53%, and WFC of 25.86%.
I did the exercise to see the dividend yield if the other banks had the same payout ratio as Citigroup. The results are the following:
- JPM 3.19% vs. 2.16%
- BAC 2.83% vs. 2.40%
- WFC 3.52% vs. 2.37%
The difference would've tightened considerably, not to mention the divergence that exists between BAC and JPM and with WFC and C in terms of consecutive years of dividend growth. The first two have managed to grow their dividend consistently annually for roughly a decade, while the two others just registered consecutive dividend growth momentum of 1 and 2 years.
Conclusion
Despite Citi performing as the worst-in-class bank in almost all aspects, I am bullish this time. I will buy into the restructuring story that cutting costs might help the company optimize efficiency and improve performance metrics to align closer to the other leading banks. Of course, reducing their personnel significantly (20,000 expected) and exiting 14 consumer markets might have near-term implications in terms of growth, but ultimately, being a financial supermarket at the global scale of Citi just brings diseconomies of scale and focusing on core markets seems to be an optimal manner of deploying their resources. With all the risks implied by Citi losing market share by sizably reducing its workforce, I rate this company as a strong buy, with all the awareness of the world knowing that these changes might take several years to improve both financial performance and stock appreciation potentially. What do you think?
